MPC
Research Projects (2007-08)
Identifying Number
MPC-292
Project Title
Traffic Safety Vulnerability Information Platform (TS-VIP) for Highways in Mountainous Areas Using Geospatial Multimedia Technology
University
Colorado State UniversityProject Investigator
Dr. Suren Chen
Description of Project Abstract
Transportation infrastructure systems are designed to move people, goods and services – both safely and efficiently. As an important lifeline infrastructure, the transportation system is a critical "backbone" for modern society and is maintained and improved through advents in technology. According to the Fatality Analysis Reporting System (FARS) by the National Highway Traffic Safety Administration (NHTSA) (http://www-fars.nhtsa.dot.gov/), there are 22653 single vehicle fatal crashes in the United States in 2005, which are 1.37 times the multiple vehicles fatal crashes. Almost 48% single vehicle fatal accidents happened on roadways with speed limits above 55 mph (mostly highways). Recent studies have found that adverse natural environmental and driver's operational conditions were blamed for many of these dangerous single vehicle accidents on highways.
It is known that the frequency and chance of serious single vehicle accidents are often significantly higher at certain locations of highways and increases further under severe weather conditions compared to other locations. Such a phenomenon is usually caused by the specific surrounding conditions, such as possible poor highway design, complicated topographic conditions and weather conditions. For example, sudden cross wind at a valley will apply on vehicles just after the vehicles moved from a segment on highways with bushes and tress on roadsides to an open area, when rollover accidents often occur; a sweep turn of highway with road surface covered by ice in winter; on some poorly designed ramps, etc. For drivers other than local commuters who are usually very familiar with the highways, like interstate drivers, commercial drivers and emergency drivers, driving without too much knowledge and preparations about these accident-prone locations could become a nightmare. Besides, highway administrations and researchers often want to investigate the possible reasons behind the higher accident risks and/or the way to avoid same problems in future highway designs. So these specific locations of the roadway with higher hazardous rates – named as "hazard vulnerable locations (HVL)" hereafter should be well identified and brought to the attention of drivers, transportation agencies and emergency management agencies with all important information.
As a result of the computer revolution of the 1980s and 1990s, information technologies has been grown dramatically and totally changed the people daily life. Some techniques have already been used to improve the highway safety, such as Dynamic Message Signs (DMS), Vehicle Telematics (e.g. OnStar technology), Intelligence Transportation System (ITS), designated weather-traffic phone number, etc. These techniques are primarily for the drivers who are already on the highways. However, it will become very helpful if the information about the HVL can be received by many drivers before the actual trip, especially when some adverse weather conditions are expected. For example, in mountainous areas, many tourists, travelers and commercial drivers drive through highways everyday, for whom, fast changing weather and unfamiliar complicated terrain can all become big challenges for driving safety and efficiency. To have some "preview" information of environmental information about those dangerous locations beforehand through advanced information technologies can be very helpful to prepare drivers not familiar with the areas, novice drivers or aged drivers.
Project Objectives
The proposed work tries to demonstrate a framework of an information system which integrates the geospatial multimedia technology just emerged in transportation engineering field and GIS techniques to assist drivers not familiar with mountainous areas (e.g. tourists and travelers), commercial, emergency vehicle drivers, novice drivers and aged drivers to have a safe and confident trip, even under inclement weather. Because of the project scope and demonstration nature, the research will choose Colorado section of I-70 as a study object for demonstration purpose. We anticipate the work may potentially help a general traveler Tom who is going to drive in I-70 in Colorado in a way described as the following scenario: After Tom printed a map from Mapquest.com, he opened a website with an interactive GIS map (TS-VIP) as he is new to this area and worries about driving safety in such a windy day. After zooming up to the section of the highway Tom is going to drive tomorrow, he finds many red dotted places marked with HLV. Clicking one dot, it shows a warning sentence "Rollover accidents prone place. Be careful on strong wind in this area". A georeferenced picture of the location and also a video clip demonstrate the roadway and surrounding views from the position of a driver through the highway segment. Simultaneously, on the GIS map, a moving dot shows the corresponding location when video plays. One point shows "foggy during Dec-Feb" with a video clip about the roadway and surroundings of the HVL captured from a driving vehicle, and another one shows "sharp curve with big slope" and related video. After watching the video clips and the printed TS-VIP map, Tom feels much more confident on his trip.
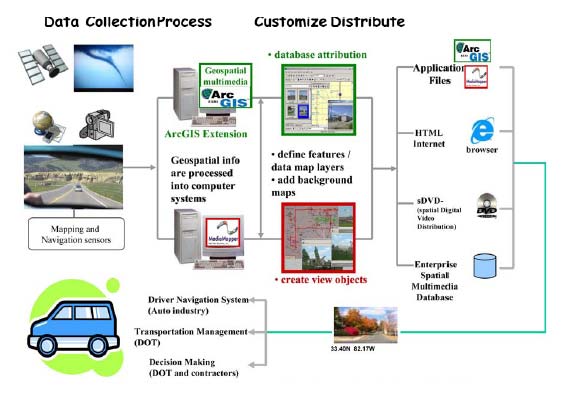
Fig. 1 Traffic Safety Vulnerability Information Platform (TS-VIP)
As shown in Fig. 1, the proposed TS-VIP will include 1) Data Collection: identify hazard vulnerable locations with historical accident data and incorporate existent warning information on the static signs along the highway; collect the GPS-based multimedia information through those selected segments. Both geospatial information and related environment information (wind speed and actual geospatial-video) can be collected and georeferenced; 2) Data Process/Customize: all the collected information will be processed and modeled. The information will be fed into the GIS system to develop the GIS database, which will be available to general drivers, highway administrations and commercial fleet companies through Internet, and to export in the format of other standard GIS data files for further implementations (Fig.1); 3) Information Distribution: Once the GIS-based database is developed, various ways can be used to distribute the information, such as producing application files, through Internet, producing DVD and developing enterprise spatial multimedia database (Fig. 1). Because of the scope of the project and also the demonstration nature, only Internet distribution will be pursued in the proposed study.
Project Approach/Methods
Safety Vulnerable Information Collection – The fatality Analysis Reporting System (FARS) (http://www-fars.nhtsa.dot.gov/), which is operated by the National Highway Traffic Safety Administration (NHTSA), has the data of all serious accidents that occur on a public roadway and involve a fatality in the United States. Information about accidents (such as time, location) of each individual state can be retrieved. The hazard vulnerable locations (HVL) can be identified on the major highway I-70 in Colorado. These identified HVL will become candidates for the data collection. Besides, existent static warning signs information will also be collected as georeferenced features, which will be incorporated into the GIS platform. A data collection vehicle equipped with Video Mapping Systems (VMS) and anemometer will drive through the selected segments of I-70. For each HVL, environmental and traffic conditions in each direction will be continuously recorded at one-second interval. For dense HVL areas, continuous data collections will be made, including the geometry of the highway, surroundings, bridges, ramps, rails and wind speed all on georeferenced basis.
Geo-Spatial Technology Implementation – The information based on GIS platform has strength about integration of transportation-related data and the ability to display spatial, numerical, and descriptive information in a visual manner as well as create, organize and analyze databases. The technology consists of two major components: navigation system and the mapping sensors. The navigation component, typically a GPS receiver combined with an inertial navigation system or laser range finder, should be capable of continuously determining the complete position solution. Mapping sensors typically include digital cameras, video cameras, and audio device. Data collection, storage, manipulation and display of pertinent features useful for transportation safety and traffic management will be made easier, less expensive and more productive with the utilization of GSMT. The GSMT consists of obtaining georeferenced multimedia, such as videotape, audio, and digital images, which includes the image and location of the desired features. Utilizing the GSMT or VMS Professional, the georeferenced multimedia is stored with each video and image. The VMS Professional has the capability of converting the GPS position (in NMEA (National Marine Electronics Association) or binary format) into an audio signal and recording this positional information on the audio channel of the videotape. Thus the video image and GPS position are stored simultaneously on the videotape. During indexing and playback the GPS position is associated (and displayed) with each image frame of the videotape. Georeferenced still images and video clips can be captured and incorporated into the GIS to develop a database of transportation management. After the video images and GPS positions are recorded, the indexing procedure produces a data table for each GPS position (or event). The sensor data (if taken) associated with each GPS position is also placed in the table. Then, the playback operation provides the opportunity to capture geo-referenced images and video clips. Afterward, the VMS can export the databases in the multiple data layers in several formats, which are compatible with ArcMap (or ArcView) and MapInfo for further analysis.
GIS-based Vulnerability Information Platform (VIP) – For decades, the primary appeal of GIS is the graphical capabilities. In fact, perhaps the first saying to come to mind is "a picture is worth a thousand words." In recent years, the rapid development of the Internet has enabled the distribution the GIS-based information immediately to everywhere in the world. The proposed work will develop the HVL information layer on top of the USDOT transportation base map. A GIS database will be developed to describe the location, elevation, text warning message, georeferenced still pictures and video chips. The database will have full query function, and will be updated by the researcher every week to give more adaptive and timely information. A website will be developed, and display the map and also the progress of the project.
Contributions/Potential Applications of Research
The project will develop a transferable database and website to display the GIS-based multimedia information system for transportation safety and management. The proposed project will have following benefits:
- Demonstrate a promising approach to promote the transportation safety with advanced information technology;
- Help transportation agencies to better manage and study the reasons and prevention strategies of high accident risks with both spatial information and environmental data already and processed; also supply information for highway designers and researchers to improve the highway design and safety researches.
- Help commercial drivers, emergency vehicle drivers and general drivers to get an actual "preview" about those dangerous locations through multimedia demonstration through Internet before the actual travel. Such a "test driving experience" through some critical locations can share the most straightforward information to drivers not familiar with the roads, novices and aged drivers, especially when an impending inclement weather is expected.
Technology Transfer Activities
An MPC Technical Report will be submitted and the project results will be disseminated via a Transportation Learning Network teleconference presentation.
Time Duration
July 1, 2007 - June 30, 2008
Yearly and Total Project Cost
$67,522
TRB Keywords
Safety, traffic, geospatial mutlimedia, highway, accident